Monday 9 September 2013
It is easy to criticise the Green Deal, and many people have done just that in the last few weeks, but it is a very complex response to a complex problem – how to make the UK’s housing stock more energy efficient.
It is inevitably a camel – that is to say a horse designed by a committee. We need to use this first phase of implementation, and let’s face it we are only in month 9, to measure results, learn and improve the system. It is now generally agreed that the most cost effective way of addressing our energy issues of high costs, energy security and emissions, is by improving energy efficiency and this is undoubtedly happening at an increased rate due to high energy prices.
Even recently we had statistics that showed average household energy use has gone down by 25%, most of this is probably due to economising – switching things off more often or turning thermostats down – but some is due to previous energy efficiency programmes such as CERT and CESP (now replaced by ECO). Our challenge is how to improve the rate of improvement of energy efficiency beyond its “natural” rate and the Green Deal is a serious attempt to do this in the residential sector, possibly the hardest sector to address.
To improve the rate of energy efficiency improvements we need to build demand for greater efficiency, build supply of efficiency goods and services and build the flow of finance into energy efficiency investment. The Green Deal attempts to do all three. The problems include; we don’t know how to build demand for efficiency – despite high prices people don’t wake up and say I want to buy an energy efficiency retrofit for my house (or building). Behavioural economics, changing local social norms and identifying the factors that really push people to make such a major decision are all critical factors on the demand side.
On the supply side we need to greatly improve the accuracy of energy modelling – the approach taken by Green Deal just isn’t good enough. Other countries have similar problems – in California research shows that a frighteningly high proportion of energy surveys get the savings wrong by 50% – a major error especially if you are investing yours or someone else’s money.
Accessing the right kind of finance is critical – the Green Deal’s 6.9% interest rate is too high for home owners with good credit. Those with cash in the bank may use that rather than borrow. We need to use the public money put into Green Deal into better research on all three aspects, demand, supply and finance – rather than on marketing campaigns that are doomed to only push a few people into action. We need to learn how to create market pull. Of course the number of people having Green Deal assessments is much higher than the 132 signed up for implementation last month – we also need to see how many of the others have taken action on their own without further involvement from the Green Deal. Then we will get a better idea of what is working and what is not.
Monday 2 September 2013
In previous blogs we have discussed the pros and cons of Energy Performance Contracting (EPC) as a mechanism to enable financing of energy efficiency investments and seen that EPCs have a number of issues and may not be suitable in all situations. In the EU the main focus of attention is still on fostering growth of the EPC market, (which to be clear is a worthwhile objective), but in the USA we are seeing a flowering of innovation in contract forms and financial structures. Some of these innovations have the potential to unlock a huge market and transform energy efficiency financing into a mainstream market, rather than the rather small niche market it is today. Here we take a look at the emerging contract structures.
PACE
Property Assessed Clean Energy financing (PACE) is a modification of an old approach to funding public goods. Benjamin Franklin invented the original concept in the 1700s to finance investment in sewers. PACE is a senior obligation which is on an equal footing with other taxes on the house and the system is still commonly used to finance sewers and projects to put utility wires underground. It is tied to the house and not the owner or tenant. PACE was first used in California and the first schemes were operated in two very different Californian markets, Berkeley – which has a mild wet climate and liberal politics – and Palm City which has hot dry climate and conservative politics – and it was a success in both markets.
Despite its subsequent adoption in 28 states and Washington DC and rapid growth, PACE in the residential market has been stopped by a controversial decision by the Federal Housing Finance Agency (FHFA) to limit its use in housing. Since then several states have started to implement PACE schemes in the commercial sector and these hold great promise. The potential for commercial PACE is estimated at $2.5 to $7.5 billion annually in 2015 with a total opportunity of $88 to $180 billion in large commercial buildings alone. The largest project to date, recently announced, is a $3.16 million retrofit to a four building, 250,000 square feet, office park in Sacramento California. The retrofit was financed through Clean Energy Sacramento, a city-wide programme backed by up to $100 million of financing from Ygrene Energy Fund.
Efficiency Services Agreement (ESA)
In the ESA structure, pioneered by Metrus, the agreement leads to the contractor being paid purely for savings on a price per MWh basis. This makes the client – contractor agreement much more of a services agreement than a traditional EPC and therefore can help in getting the project off the client’s balance sheet. Metrus contract with service providers (ESCOs) who guarantee a level of savings to Metrus. Metrus have applied this structure to a number of sites including four sites belonging to BAE Systems and invested $8 million. It is now rolling it to other BAE Systems’ sites in the US.
Managed Energy Services Agreement (MESA™)
The MESA™ has been pioneered by SciEnergy. It involves the contractor taking over responsibility for the clients energy bill and the relationship with the utility provider(s). The building owner then pays the contractor the historical energy bills corrected for weather and other factors i.e. what they would have paid. SciEnergy invests in energy efficiency upgrades.
On- bill repayment (OBR)
On-bill repayment, where the repayment of capital is added to utility bills, is also growing but this is more of a collection mechanism than a type of financing, as it can be tied to various contract forms. Investment funds for many OBRs came originally from stimulus money or utilities mandated to invest in efficiency but there is a move towards attracting private investment. Work is typically carried out by a certified contractor who often introduces the client to the financing scheme. OBR has been mainly used in the residential sector but is now attracting attention in the commercial sector. In 2011 New York was the first state to enact state-wide OBR and offers finance at 3.49%. The New York State Energy Research and Development Authority (NYSERDA) is currently issuing $24.3 million of AAA rated bonds backed by residential energy efficiency loans – 35% of which were on-bill loans and the rest being direct with the householder. The UK Green Deal is a form of OBR with external financing provided through the Green Deal Finance Company and faces many of the same difficulties as OBR schemes in the US such as generating sufficient demand and the accuracy (or otherwise) of building energy models that are used to predict savings.
Measured Energy Efficiency Transaction Structure (MEETS)
MEETS is the latest structure to emerge and was developed by EnergyRM and applied to the Bullitt Foundation’s “Living Building” in Seattle. It uses EnergyRM’s “DeltaMeter™ dynamic baseline metering system” which is a system for measuring savings that has been approved by the utility industry in the Pacific North West. The client pays the agreed price per unit of energy as per normal and an agreed price per unit saved (negawatt hour) on a 20-year agreement similar to a Power Purchase Agreement. The advantage is that the repayment is linked to the building rather than the occupier and this allows a longer time-frame to be considered when looking at retro-fit options – allowing deeper retrofits to be financed. The system is well suited to US markets where the utilities are mandated to make energy efficiency improvements (which of course includes EU countries after the implementation of the Energy Efficiency Directive).
Conclusions
The US is seeing significant innovation in energy efficiency financing, prompted by the falling away of stimulus money over the last few years. Although currently small, these new contract forms have the potential to grow the energy efficiency financing market from its (2010) level of c.$14 billion (some $3 billion of which was stimulus money) to more like the $100 to $200 billion market some analysts predict it could become. Commercial PACE shows particular promise. With the exception of the Green Deal, which is an on-bill repayment scheme, we have yet to see these kinds of innovation in Europe, and some structures such as PACE are constrained by existing property taxation systems. To grow the market for energy efficiency financing to the level we know it could achieve, and the level we need to hit environmental targets, we need to recognise that EPCs are not the be-all and end-all and foster greater innovation in contract form and financial structure.
Dr. Steven Fawkes
Steve’s latest book, “Energy Efficiency: the Definitive Guide to the Cheapest, Cleanest, Fastest Source of Energy”, will be released in September. It is available with a pre-publication discount of 35% by using the link to the right of this page
Monday 26 August 2013
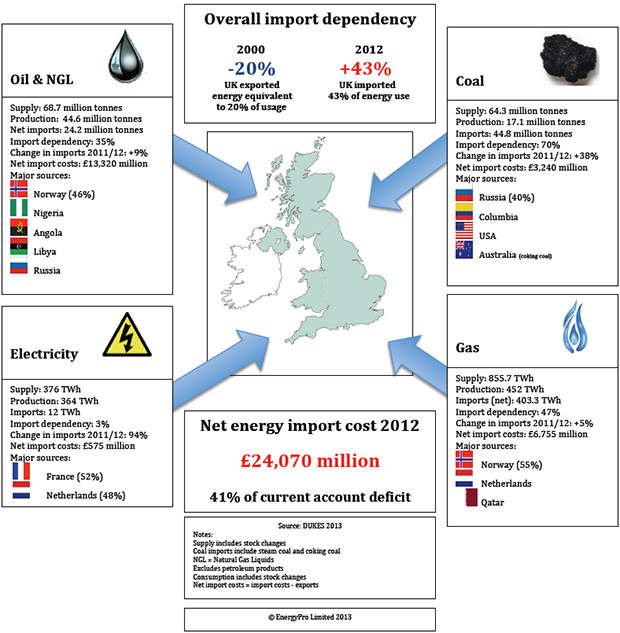
Following my note on DUKES one of the important aspects of the UK energy picture that is illustrated by DUKES 2013 is the growing dependency on imports – the dependency has increased from -20% (i.e. net exports equivalent to 20% of energy supply) in 2000 to +43% (i.e. net imports equivalent to 43% of energy supply) in 2012. This infographic summarises the supply, production and import statistics for crude oil, gas, coal and electricity. Net energy import costs in 2012 were £24 billion, 41% of the current account deficit and c.1.5% of GDP.
Monday 19 August 2013
The 25th of July saw the annual publication of DUKES – the Digest of UK Energy Statistics – with the release of DUKES 2013. DUKES is the starter for ten for all UK energy sector analysts and has been published pretty much in its present form for many years, making it a consistent set of government statistics. Even a quick scan of DUKES can give you a good feel for what is actually happening in UK energy, as opposed to the many opinions on what is happening which are expressed in the media. It shows short-term changes and long-term trends.
Some notable highlights I picked up from the press release and DUKES itself, along with some “flash” first impressions – some of which merit further analysis – follow.
Primary energy production and import dependency
Primary energy production in the UK fell by 10.7% on a year earlier due to the continued decline of oil and gas production from the UK Continental Shelf. Production is now less than half of its 1999 levels, an average annual rate of decline of 7.1%. Gas production has fallen 64% since its peak in 2000 while production of oil has fallen 67% since 1999.
Energy imports were up 6.9% on 2011 levels, reaching record levels. For oil the major supplier was Norway (46%) with a large growth in imports from African OPEC countries. For gas Norway accounted for 55% of UK imports. LNG imports were down from 47% to 28% of total imports with 98% of the imports from Qatar. The main source of coal imports was Russia (40%) with Columbia supplying 26% and the USA 24%.
Overall the dependency on imports reached 43% – continuing the upward trend from 2004 when the UK became a net importer.
Oil and gas production from the Continental Shelf continues to fall dramatically despite some talk of a resurgence. Increasing dependency on energy imports increases the vulnerability of the country to supply disruptions, whatever their cause, and exports money and jobs. Current instability in some energy producing countries and regions is worrying. Looking forward at the global energy situation over the next ten to twenty years, many of the exporting countries will have rapidly increasing domestic demand, and this plus the increase in the global middle class – particularly in Asia – will put increasing upwards pressure on energy demand and increase competition for available energy exports.
Final energy consumption
On a temperature adjusted basis final energy consumption was down 0.9%, continuing the downward trend of the last eight years. Consumption in the domestic sector and services sector increased (due to cold weather) while industry, transport and non-energy use all declined, (2.9%, 1.4% and 10% respectively).
Looking at the longer term energy consumption in 2012 was 4.5% lower than in 1990 – with a 34.9% reduction in industry, a 1% reduction in services, public administration and agriculture, a 9.5% increase in transport and a 5.9% increase in domestic.
Energy consumption per unit of output, i.e. a measure of energy efficiency, fell by 47% in the chemicals sector between 1990 and 2012 – with chemicals accounting for 16% of all industrial energy consumption. For iron and steel there was a 12% reduction and for all industries a 33% fall.
In the private commercial sector energy consumption fell by 12% between 1990 and 2012 while economic output from the sector increased by 79% in real terms. In the public sector consumption fell by 13% while output increased by 45%.
Energy demand continues to fall – the 4.5% fall since 1990 is interesting as clearly the economy has grown considerably since then (despite the current poor economic performance resulting from the global financial crisis). Some of this is clearly due to changes in the structure of the economy and some is due to improved energy efficiency. The old idea of a fixed relationship between GDP and energy use is breaking down but we can, and need to, accelerate the rate of reduction in energy intensity through improved energy efficiency in all sectors.
Oil consumption
Oil consumption, 75% of which is for transport, fell 2% with transport showing little change since 2011. Diesel road fuel grew again in relation to petrol due to the continued switch towards diesel in cars. Petrol (motor spirit in official parlance) consumption has fallen 4.4% per annum in the past 10 years while diesel has grown 2.4% per annum. Biofuels account for 3.1% of road fuel.
Aviation fuel demand has increased by 20% since 1998 but is down 11% on the 2006 peak, demand since then has been fairly constant at 11 to 11.5 million tonnes. Growth in passenger demand has been quite strong since the downturn but fuel demand has remained roughly constant due to increased fuel efficiency in the airline industry.
Transport energy remains pretty much unchanged – the shift to diesel in cars continues pushed by fuel efficiency standards making manufacturers introduce more diesel models, even in high-end ranges which previously were nearly exclusively petrol driven. Overall the UK is a net exporter of petroleum products and the switch to diesel has resulted in a mis-alignment between UK product demand and UK refining capacity – we export petrol and import aviation fuel.
The aviation fuel story is interesting – passenger demand growing and fuel use constant is a result of the combination of several effects – airlines retiring older fuel inefficient aircraft, buying more efficient aircraft and increasing utilization levels by changing schedules. Pressure to improve efficiency in aviation continues and the introduction of new aircraft such as the Boeing 787, which has demonstrated a 20% improvement in fuel efficiency in actual operation, (not marketing hype), despite early aircraft being over-weight, will continue this trend.
The electricity sector
Total electricity supply increased 0.6% to 375.9 TWh and UK production of electricity fell by 1% so net imports almost doubled to 12.0 TWh (3.2% of the total).
High gas prices led to a switch to coal for electricity generation, with coal increasing its share of generation from 30% to 39%. This led to a 6% fall in overall gas demand and an overall increase of 24.5% in coal consumption. Driven by this coal imports rose 38% to 45 million tonnes (still 11% lower than the record level in 2006).
Nuclear generation remained constant at 19%.
Electricity from renewables increased by 19%, taking the total generated by renewables up to 11.3% from 9.4%.
Installed capacity of renewables rose 27%, mainly due to a 27% increase in onshore wind capacity, a 63% increase in offshore wind capacity and a 71% increase in solar PV capacity.
The growth of coal use sneaked up on nearly everyone but should not have been surprising with the high price of gas. The generators are clearly maximizing the output of the remaining coal stations which are a mixture of those plants that have been retrofitted to allow operation under the Large Combustion Plant Directive and those that are due for closure and are on their last legs. Clearly this increase in coal use will have an effect on overall carbon emissions.
We will see nuclear production drop off as older plant shut in the next few years. Given the time to build new plant (see an earlier post “Six impossible things before breakfast”) it is unlikely to recover from that drop much before 2022/23.
The growth of renewables is impressive although of course all these numbers are from a low base – not surprisingly feed in tariffs work. Whether the increase will continue at that pace post the Electricity Market Reform (EMR) and the new system of Contracts for Difference (CfDs) we will only see over the next three to five years.
Energy spend
Although the quantity of energy consumed has gone down, from 160 million tonnes oil equivalent (mtoe) to 140 mtoe since 2000, the expenditure on that energy by final users has gone up from c.£60 billion to c.£137 billion. 56% of this expenditure was on transport, 24% the domestic sector, 10% industry and 10% the services sector.
Oil prices in 2012 averaged $112 per barrel, unchanged since 2011 but up from $80 per barrel in 2010.
As everyone knows energy bills have gone up.
Monday 12 August 2013
In 1979, a period dominated by high oil prices and deep concerns about the future supply of energy resources, Gerald Leach and a team from the International Institute for Environment and Development (IIED) wrote an important book called “A Low Energy Strategy for the UK”. It was controversial at the time as it stated that “the United Kingdom could have 50 years of prosperous growth and yet use less primary energy than it does today”. This, the study argued, could be achieved by improving thermal performance of new buildings, implementing energy performance standards for cars and major household appliances, and improving industrial energy efficiency. Leach’s scenario was similar in message to Amory Lovin’s more famous “soft energy path” for the USA, published in “Energy Strategy: the Road Not Taken” in 1976. Both advocated a bottom-up approach to energy modeling rather than the prevailing top-down approach and forecast future energy consumptions much lower than the prevailing official forecasts – both turned out to be more accurate than the official forecasts when it came to actual energy consumption.
Leach’s conclusion (and that of Lovins in the US) was controversial at the time as official government scenarios were still based on the belief, (perhaps still current in some circles), that there was a rigid link between energy use and GDP – something that was probably true between 1953 and 1973 – a period when affluence was increasing along with the ownership of cars and energy using appliances. The Department of Energy projections for primary energy use were between 32% and 63% higher than the 1976 consumption (460 to 570 million tonnes coal equivalent (mtce) compared to the 1976 consumption of 349 mtce). The Leach analysis was widely considered to be unrealistic by the energy establishment at the time so nearly 35 years later it is interesting to compare the Leach scenarios with what actually happened.
Table 1 summarizes the Leach et.al. scenarios, the official UK Department of Energy scenarios of the late 1970s, and the actual out-turn for UK primary energy consumption. To avoid confusion over energy units (Leach used mtce, now primary energy is reported in mtoe – million tonnes oil equivalent) and different inflators for GDP I have converted everything to indices starting at 100 in 1976.
Table 1. Summary of Leach scenarios, Department of Energy scenarios and actuals.
| 1976 | 1990 | 2000 | 2010 | 2025 | |
| Leach GDP scenario (low) | 100.0 | 141.3 | 172.3 | 188.5 | 203.1 |
| Leach GDP scenario (high) | 100.0 | 141.3 | 191.8 | 231.4 | 293.7 |
| Actual GDP | 100.0 | 144.5 | 189.9 | 226.1 | – |
| Department of Energy primary energy forecast (low) | 100.0 | – | 132.0 | – | – |
| Department of Energy primary energy forecast (high) | 100.0 | – | 164.0 | – | – |
| Leach primary energy (low) | 100.0 | 102.5 | 94.5 | 88.5 | 84.5 |
| Leach primary energy (high) | 100.0 | 108.8 | 103.3 | 102.2 | 99.9 |
| Actual primary energy use | 100.0 | 103.9 | 114.2 | 105.4 | – |
Interestingly enough the actual GDP out-turn has been squarely in the Low-High scenario range outlined in Leach which were in-line with the official reference forecasts used by the Department of Energy at the time. So the economic forecasts were basically good. Two things really stand out:
- the big difference between the Department’s forecast for primary energy use in 2000 and the actual out-turn
- the actual 2010 primary energy use is close to Leach’s high scenario.
Looking at energy use per GDP ratios we can see that the official Department of Energy forecast a range between 0.76 and 0.85 for 2000, Leach’s scenario was between 0.54 and 0.55, (considered outrageously low and impossible by the establishment), and the actual out-turn was 0.6.
Whatever the causes, we are practically living in what was defined in 1979 as a radical, low energy future.
Now this is a very simple analysis and of course there are a number of factors that turned out to be different to the scenarios and will affect the conclusions including:
- the sectoral breakdown of the economy now looks different to the scenarios of the late 1970s, (industry making up 30% of GDP by 2010 compared to an actual of 24%)
- the sources of primary energy projected also look different to reality. The use of gas was seriously under-estimated, Leach projected 14% of primary energy in 2010 would be gas, in reality the number was more like 35%, as the use of gas for power generation was restricted until the 1980s.
Given the importance of energy forecasts at the current time it is useful to review old future energy scenarios and see what we can learn.
There is an interesting quote in Leach (p.186) in response to the then government’s plans to expand generating capacity and nuclear power that has a strange resonance today:
“The enormous investments for new power stations assumed in official forecasts are vastly reduced. The current Department of Energy forecast estimates that 83 GW of new plant must be built in the UK by 2000. Our figures are 26 and 30 GW for the Low and High cases respectively. At an estimated £500 per kilowatt installed capacity for plant only (at 1977 costs) the investment savings on our projections are of the order of £26 – £30,000 million, or well over £1,000 million a year. We should be very surprised if this sum did not amply cover the costs of all the energy conservation measures assumed in this study.”
Interestingly, the 83 GW of new plant needed by 2000 referred to here is about the same as the total UK generating capacity today. The Department of Energy’s “reference forecast” for 2000 also included 40 GW of nuclear capacity (compared to the actual today of 10 GW).
Maybe we haven’t learnt very much about energy forecasting. A lot of the basis of the planning for the current Electricity Market Reform (EMR) was built on DECC scenarios which showed significant increases in electricity demand, up to a doubling of demand by 2050, based partly on assumptions about the electrification of heat and the spread of electric vehicles. Other scenarios, some of which showed demand going down, were discounted. For details see the report, “A corruption of governance” by the Association for the Conservation of Energy (ACE):
My conclusions from reviewing Leach’s “low energy strategy”, Lovin’s “soft energy path” and other studies are as follows:
- government forecasters and indeed most mainstream analysts have trouble seeing outside the perceived wisdom of the time – the prevailing paradigm.
- official forecasts tend to overstate future energy use.
- bottom-up, technically based, demand led models may be more reliable than economic top-down models.
- the link between energy and GDP is more complex than we thought – but it is weakening over time.
- we achieved significant improvements in overall energy efficiency consistently over a 35 year period, during which energy efficiency was really only a major concern for about ten years between the mid-1970s and mid-1980s.
- energy efficiency has effectively delivered more energy services than any other source of energy.
- the Leach book should be required reading for energy analysts and policy makers. Although long out of print copies can be found on Amazon and Abe Books.
The final point – if we effectively achieved a “low energy” future without paying attention to increasing the rate of reduction in energy intensity the question is what could we achieve if we actually do pay attention to the energy efficiency resource?
Dr Steven Fawkes
Welcome to my blog on energy efficiency and energy efficiency financing. The first question people ask is why my blog is called 'only eleven percent' - the answer is here. I look forward to engaging with you!
Get in touch
Email notifications
Receive an email every time something new is posted on the blog


Tag cloud
Black & Veatch Building technologies Caludie Haignere China Climate co-benefits David Cameron E.On EDF EDF Pulse awards Emissions Energy Energy Bill Energy Efficiency Energy Efficiency Mission energy security Environment Europe FERC Finance Fusion Government Henri Proglio innovation Innovation Gateway investment in energy Investor Confidence Project Investors Jevons paradox M&V Management net zero new technology NorthWestern Energy Stakeholders Nuclear Prime Minister RBS renewables Research survey Technology uk energy policy US USA Wind farmsMy latest entries